Before you explore international trade...
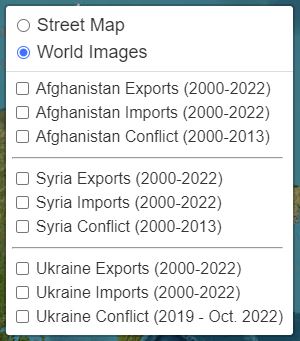
Welcome to our interactive trade flow map. Use the checkboxes to toggle which datasets you would like to view (exports, imports, as well as a box denoting when each conflict occurred). Trade flows are shown as growing and shrinking circles, with quantities adjusted by a factor of 1 million USD ($). To get the exact trade value at a period in time, pause the animation and click on the circle marker at the desired point.